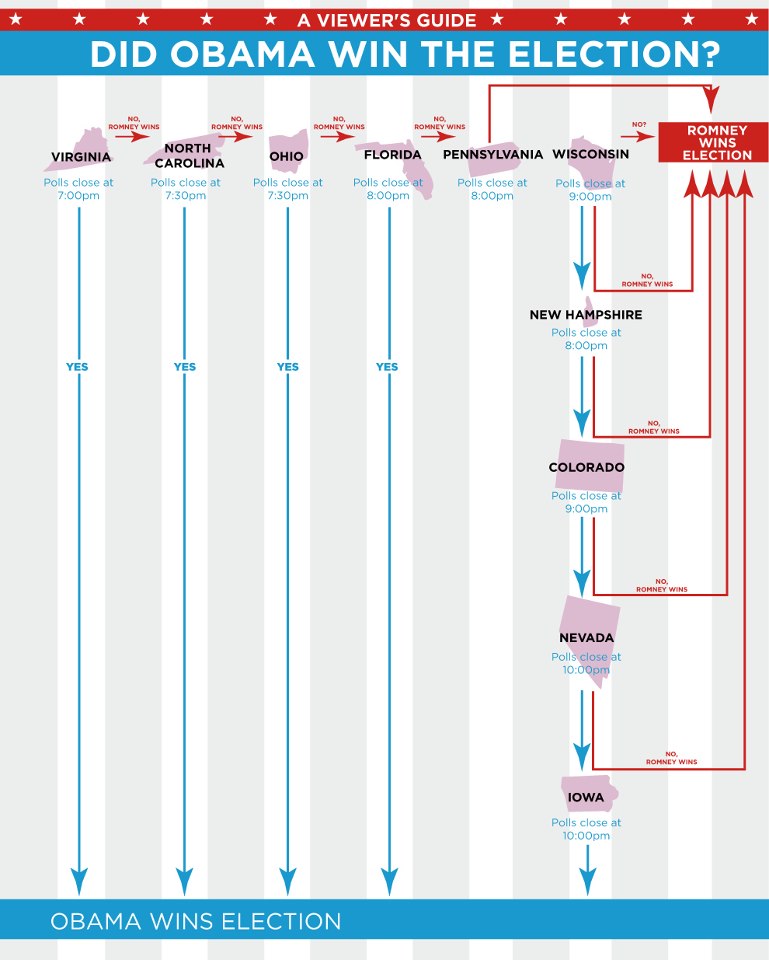
Ok, so you want to know who wins the election, but you don’t want to be glued to the media all day. Here’s your guide to the important events that will determine the outcome. The only problem I see is that they give only closing time for the polls. In some states, it could take hours or even days after the polls close to determine a winner.


5 Comments
Am I missing something here, or does this seem to be overly simplified? If we assume all of those states are in play, there is no single state that would be enough to call victory for Obama. For example, if he wins Pennsylvania (which most people are assuming) and Florida, he still needs one of the other states in this list to hit 270.
Its an exciting day! I appreciate your sharing the flowchart, but it’s pretty confusing and difficult to follow.
The biggest problem is the missing Yes answer out of PA and the lack of input to WI. I am guessing that those were supposed to be linked.
I gather from this flowchart:
For Obama to win he must win one of: VA or NC or OH or FL or all of these: PA & WI & NH & CO & NV & IA.
For Romney to win he must win all of these: VA & NC & OH & FL, plus either PA or all of these: WI & NH & CO & NV & IA.
That’s confusing, since theoretically this chart says Obama could win VA and lose every other state on the chart and still win the election.
I’m not sure, but I think the chart assumes that if certain states go one way, it is likely that other states will also go that way. So while this is not a complete chart, it is showing the most likely scenarios.
For example, if Obama wins North Carolina it is a pretty sure bet he will be doing well elsewhere.
Yes out of Pennsylvania goes to Wisconsin.
I suspected that was the underlying assumption, but I’m not sure it holds up. I get Florida – if Obama wins Florida, Romney basically has to run the map everywhere else, which seems so unlikely that an Obama win in those circumstances is all but certain. Likewise, if Obama pulls off a win in North Carolina, he’s obviously doing enough better than the polls suggest that it will carry over to other states. However, I’m less certain that the same holds true for Virginia and Ohio.
I think this New York Times interactive version does a much better job: http://www.nytimes.com/interactive/2012/11/02/us/politics/paths-to-the-white-house.html
Thanks Drew! The NY Times one is cool, I’m having lots of fun playing with it. What I liked about the original chart was it gave you times at which key events would take place.
In fact, one way to play this game is to use the chart to see times to tune in. As each battleground state is decided, check it off in the NY Times one, and see the paths to victory shrink.
Of course, even the NY Times one makes assumptions. It is limited to nine major battleground states. Obviously, in some alternate universe Obama could win all nine of those, and somehow lose other states he is expected to win (let’s say California) and Romney would win.
But we are talking likelihoods, of course.
One Trackback/Pingback
[…] Who Won The Election (politicalirony.com) […]